As we continue to roll on through the offseason and prepare for the 2023 fantasy season, we are taking a top-down look at the production for each position.
We kicked things off by looking at the how and the why that scoring last season completely fell off the map.
We then followed that up with a look at the quarterbacks, running backs, and tight ends.
Next in line, we are taking a top-down look at the wide receiver position.
Highlights:
- Wide receiver counting stats declined with the league output falling off, but their overall usage rates remained high and increased in share of the league’s receptions and receiving yardage from the previous season.
- When teams intend to throw the football, they have three or more wide receivers on the field for nearly three-fourths of passing plays.
- Target WR3 options on teams that project to sustain a high rate of dropbacks with high usage of 11 personnel.
- With NFL offenses reducing passing volume and playing more 21 personnel, the leaguewide use of 4WR sets fell completely off a cliff.
- With NFL offenses reducing passing volume and condensing their offense, fantasy WR1 options carried more leverage in terms of wide receiver production.
Leaguewide Wide Receiver Usage Since 2010:
| YEAR | TGT/Gm | League % | Rec/Gm | Lg% | ReTD/Gm | Lg% | ReTD/Gm | Lg% |
|---|---|---|---|---|---|---|---|---|
| 2022 | 37.9 | 59.41% | 24.0 | 56.10% | 302.1 | 64.43% | 1.7 | 60.40% |
| 2021 | 39.5 | 59.55% | 24.9 | 55.89% | 311.0 | 63.71% | 1.9 | 62.02% |
| 2020 | 40.6 | 60.02% | 26.5 | 57.79% | 334.0 | 65.53% | 2.1 | 61.42% |
| 2019 | 39.1 | 58.34% | 24.1 | 54.43% | 315.5 | 62.71% | 1.9 | 60.30% |
| 2018 | 39.5 | 58.84% | 24.9 | 55.51% | 318.9 | 62.67% | 2.1 | 62.81% |
| 2017 | 38.7 | 57.83% | 22.7 | 53.58% | 293.2 | 61.19% | 1.7 | 58.70% |
| 2016 | 42.6 | 60.60% | 25.5 | 56.72% | 326.3 | 63.82% | 2.0 | 63.74% |
| 2015 | 41.3 | 58.47% | 24.6 | 54.65% | 322.5 | 62.22% | 2.0 | 61.64% |
| 2014 | 41.3 | 60.07% | 24.8 | 56.63% | 323.6 | 64.26% | 1.9 | 60.10% |
| 2013 | 41.4 | 59.26% | 23.9 | 55.07% | 318.8 | 63.17% | 1.9 | 60.07% |
| 2012 | 41.0 | 59.88% | 23.6 | 55.81% | 315.7 | 64.17% | 1.9 | 64.86% |
| 2011 | 39.3 | 58.73% | 22.2 | 54.39% | 307.1 | 62.73% | 1.8 | 63.49% |
If you have read the opening top-down post covering the decline in offensive performance last season, which was among the worst offensive seasons of the past decade, then it will not be a surprise to see all of the counting stats per game here continue to slide.
With pass attempts at their lowest point since the 2009 season, wide receivers combined for their fewest number of targets per game since that season. Wideouts posted their lowest number of yardage per game since the 2017 campaign while matching a low mark of receiving scores per game over this sample.
The position was able to tread some water in receptions per game since WRs are getting more targets near the line of scrimmage to boost the overall catch rate, but even receptions per game were at a low point since the 2017 season.
The position was impacted by the overall decline in offensive output, but many of the rate stats covering the position’s share of leaguewide usage remained intact.
The 59.4% share of the league’s targets was a slight dip from the previous two seasons but still higher than any of the previous three seasons before the 2020 season.
The 56.1% share of receptions was the second-highest rate since 2016 while the 64.4% share of league receiving yardage was only bested by the historic 2020 season.
The only area that remained limited compared to the totals was reaching the end zone. The 60.4% share of receiving touchdowns was the fifth-lowest rate since 2010. If you look at the start of the sample going back to that 2010 season, wideouts had over 63.0% of the league receiving scores but have hit that mark in just one season since.
Usage at the position remains strong and teams are incorporating wide receivers heavily into their offense, even if we have appeared to level off in terms of the rate of offenses using three or more wideouts per dropback.
Percentage of Wide Receivers on the Field Per Dropback:
| Year | 2+ WR% | 3+WR% | 4+WR% |
|---|---|---|---|
| 2022 | 95.64% | 73.76% | 1.05% |
| 2021 | 95.74% | 73.39% | 3.54% |
| 2020 | 95.39% | 73.49% | 3.80% |
| 2019 | 95.87% | 72.42% | 3.58% |
| 2018 | 96.26% | 75.28% | 2.52% |
| 2017 | 95.74% | 72.96% | 2.71% |
| 2016 | 96.48% | 75.27% | 4.80% |
| 2015 | 95.75% | 70.27% | 4.50% |
| 2014 | 96.19% | 69.56% | 3.43% |
| 2013 | 95.94% | 67.57% | 3.06% |
When NFL teams set out to throw the football, they had at least three wide receivers on the field 73.7% of the time.
There were only two teams last season that did not use 11 personnel (one running back, one tight end, and three wide receivers) on over 50% of their dropbacks. They were the Falcons (39.7%) and the Ravens (18.5%).
20 teams used 11 personnel on at least 70% of their dropbacks while we had seven teams use that grouping 80% or more of their dropbacks. The Rams (94.9%) and the Bengals (92.8%) were the two teams over 90%.
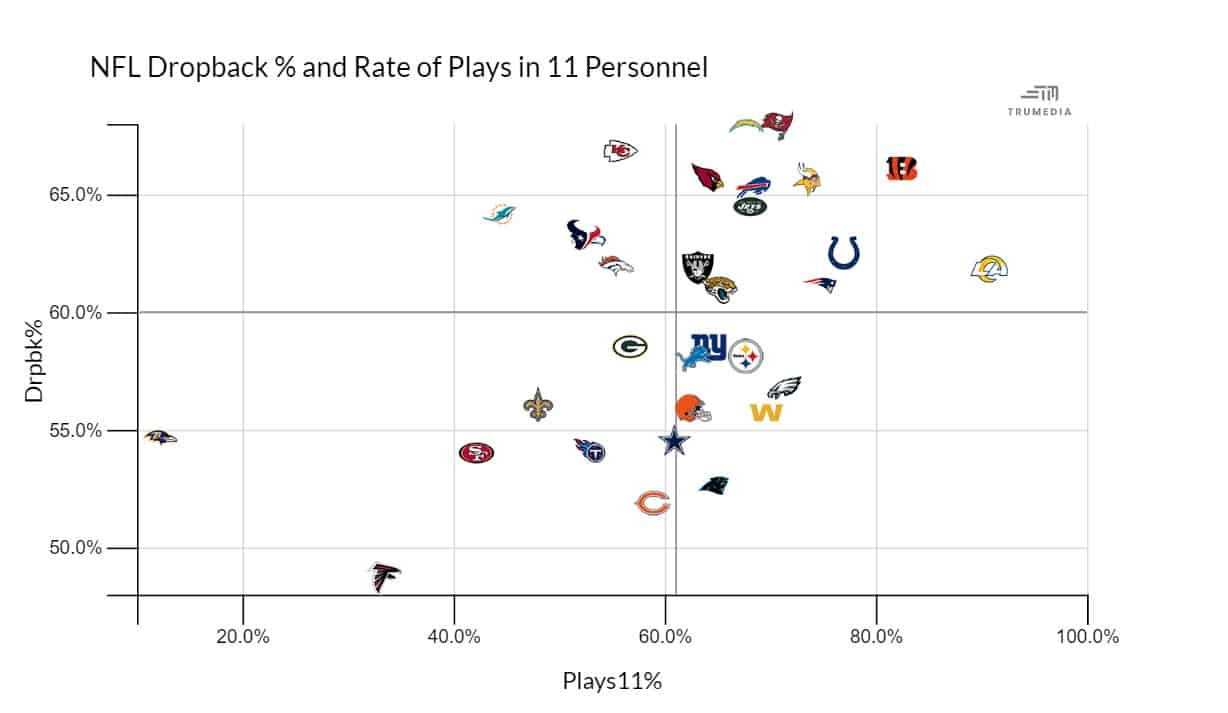
This chart includes all plays (since the dropback rate on passing plays is inherently 100%). In fantasy drafts, we want to target depth players on teams in the upper right quadrant when selecting WR3 options on teams.
Those are the teams that are not only dropping back to pass a lot but are also using three or more wideouts on the field at a high rate of plays.
There is some projection into incorporating offensive structure changes made this offseason, but if you are in current best ball drafts, wide receivers such as Tyler Boyd, K.J. Osborn, Russell Gage, Corey Davis, Tyquan Thornton, Hunter Renfrow, Zay Jones, and some combination of Van Jefferson, Tutu Atwell, and Puka Nacua are all later-round options that should at least be running a tangible amount of pass routes and can run into some usable weeks.
I believe we will see the Ravens significantly raise their rates on both of those axes with the hire of Todd Monken paired with a much improved wide receiver room from what they fielded a year ago through injuries and lack of talent.
The Bears also have a more functional three-wide receiver unit now compared to a year ago with the addition of D.J. Moore and having a healthy Chase Claypool. While I do not anticipate a massive spike in the dropback rate for Chicago, we should see them use three or more wideouts at a higher rate when they do pass.
Both the Bears and Ravens have mobile quarterbacks that can still prevent those teams from joining the upper right quadrant even with a spike in both areas, but one team that could be outright compelling this season is the Seahawks.
They were already 11th in the league in dropback rate last season, but 26th in rate of 11 personnel.
With the selection of Jaxon Smith-Njigba as the first wide receiver taken in the draft, this is a passing game that finally has the personnel to deploy three talented wide receivers and already showed us the mindset of playing more aggressively than in years past last season.
Tacking on that they entered last year with an unstable quarterback situation and that Geno Smith in turn played well, we should anticipate them moving into that upper-right area.
A couple of teams in that upper-right portion that have had changes and I expect to fall out of that area are the Cardinals and Colts.
Both teams have new coaching staffs that come directly from Philadelphia to provide hope they remain as aggressive as that offense was in neutral game scripts, but Arizona has already hinted that they are going to run heavier personnel this season.
When Anthony Richardson does start for the Colts, I expect their dropback rate to be well below where it was a year ago.
Some areas where there have not been significant changes in terms of play callers or personnel are New Orleans, Green Bay, Miami, and Kansas City. We should be cautious about tempering expectations when selecting the WR3 on those rosters.
Rookies such as Jayden Reed and Rashee Rice may have to fight for true opportunities in the passing game in their first season. At least the Chiefs do throw a lot, but the Packers are in a quadrant that gives a lot of pause and they no longer have Aaron Rodgers.
This also gives me some pause on a hopeful spike for someone such as Rashid Shaheed since the Saints are getting Michael Thomas back for at least some amount of time and was one of the more conservative offenses in the NFL.
One interesting note circling back to that opening table above that graphic is that the rise of heavy wide receiver sets was impacted by the rise in defensive coverage schemes that forced offenses into more condensed sets and running the football having more prominence than any other season over the past decade.
If you recall in the opening post of this series, we highlighted how 21 personnel increased for the first time in 15 years. Well, it came at the expense of teams using four wideouts on the field.
NFL teams used four or more wide receivers on just 1.0% of dropbacks last season. After the league had 737 dropbacks with four or more wideouts on the field in 2021, that number fell to just 212 dropbacks last season.
The next closest season (2018) over the past decade had 495 dropbacks with four or more wide receivers. While the use of four wideouts has only made up a small subset of the rate of dropbacks across the league, that is still a massive decline.
On top of that, Kliff Kingsbury is no longer in the league, whose offense led the NFL in dropbacks with four wideouts on the field in each of the past four seasons.
One final top-down area I do want to discuss is that with all of the changes that defenses have implemented to force offenses into more condensed areas of the field while reducing the number of overall dropbacks overall across the league, have those elements made lead wide receivers more viable?
Just about every team in your fantasy league had points on their roster at the wide receiver position in recent seasons due to the passing-rich historic output.
In turn, paired with the amount of three or more wideouts on the field, that impacted the value of the WR1 in fantasy circles in recent years, with the WR2 and WR3 depth of fantasy scorers slowly creeping up into the rate in which they have matched premier scorers at the position.
Fantasy WR1 (Top-12) Share of Wide Receiver Production Since 2010:
| WR1 | PPR PT % | TGT % | REC % | REYD % | RETD% |
|---|---|---|---|---|---|
| 2022 | 19.57% | 17.37% | 18.05% | 19.96% | 23.62% |
| 2021 | 19.43% | 16.74% | 17.92% | 18.87% | 21.49% |
| 2020 | 18.05% | 15.53% | 16.49% | 17.52% | 23.73% |
| 2019 | 18.45% | 17.03% | 18.38% | 18.56% | 19.58% |
| 2018 | 20.15% | 18.11% | 19.68% | 20.33% | 21.24% |
| 2017 | 19.23% | 17.57% | 19.10% | 19.76% | 19.31% |
| 2016 | 17.88% | 15.78% | 17.07% | 17.50% | 22.09% |
| 2015 | 20.51% | 18.39% | 19.75% | 20.41% | 23.42% |
| 2014 | 20.36% | 16.79% | 18.37% | 20.39% | 25.36% |
| 2013 | 20.35% | 17.85% | 18.67% | 20.60% | 24.07% |
| 2012 | 20.31% | 18.28% | 19.74% | 21.04% | 20.86% |
| 2011 | 19.74% | 16.27% | 17.97% | 20.17% | 22.62% |
| 2010 | 19.11% | 17.21% | 17.80% | 19.23% | 24.27% |
With offenses becoming more concentrated by default of the environment of the league last season, front-end wide receivers for fantasy accounted for more of the wide receiver production than in recent years.
We were not quite back to the level of contributions at their apex, but WR1 options received their highest share of leaguewide targets, receiving yards, and fantasy points since the 2018 season. That group had their second-largest share of receiving touchdowns in the past eight seasons.
More wide receivers are catching passes than ever before, but the WR1 share of receptions was also higher than in the previous two years.
If the NFL is going to operate similarly this upcoming season or even swerve further into condensing their offense, focusing on the WR1 group having increased elevation at the position is noteworthy.
Even if we do not get back to the elite WR1 dominance of the early 2010s, giving more emphasis to the best players at the position supports the movement of aggressively drafting the position that we are seeing in drafts this summer.
[/wlm_private]