As we are preparing for our 2023 fantasy drafts, we are going to dive into the recent history of average draft positions to pull away any ongoing trends or pitfalls.
Every year, we have nearly eight full months to prepare for the draft, but just how good are we at setting the market for the season?
Today we are looking at running backs. We have already covered the quarterback, wide receiver, and tight end positions.
Running Back Fantasy Related Articles:
- Running Back Tiers
- Running Back Rankings
- Running Back Trends
- Red Zone Points vs Expectation: Running Backs
- Stats That Matter For Fantasy Football: Running Backs
Highlights:
- The 2019-2022 seasons account for four of the top-five seasons in ADP correlation to points per game at the running back position.
- There are 42 seasons on our chart in which a running back has averaged 20 or more points per game. Just four of those came from players selected at RB30 or later.
- 36 of those 42 seasons came from running backs that were selected within the top-12 of their position that season.
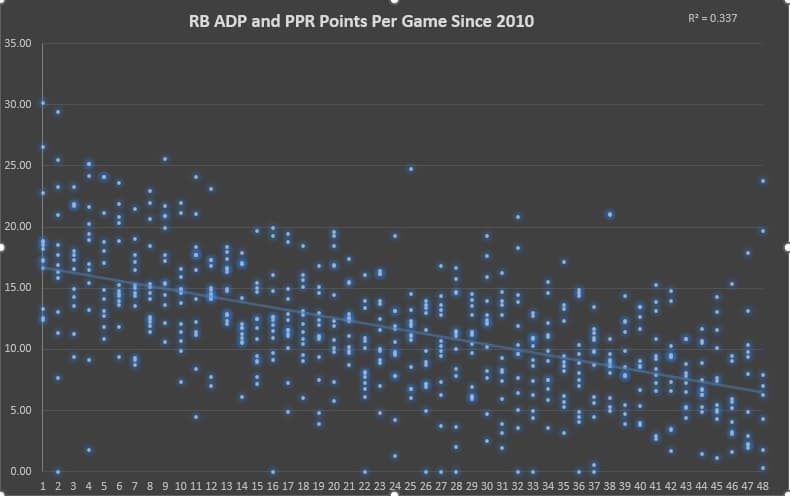
RB ADP vs. Points Scored since 2010:
The 2022 season was another successful year for fantasy football drafters as the correlation between average draft position and points per game was well above the base rate of our entire sample.
Something we have taken note of in this series in the past is how we are collectively sharper than ever at setting the draft markets at each position.
Yesterday, we highlighted how strong we have been at setting the market at the quarterback position in recent seasons, and the running back position falls right in line with that.
With actual objective analysis impacting how fantasy football is played now more than ever, I don’t believe this is a coincidence.
We still are wide open for volatility, but by and large, analysts and consumers are collectively better fantasy gamers than they were a decade ago and it shows.
I mentioned it with the quarterbacks, but gamers are now able to identify which types of quarterback archetypes offer the highest floors and ceilings and those players are the most expensive to obtain.
I believe the same thing has happened at running back.
With running back touches at an all-time premium and three-down assets drying up in recent seasons, gamers have a smaller pool of backs that we can project to contribute as workhorse backs in all facets of the game out of the box.
Top-48 RB in ADP and Correlation to PPR Points per Game Since 2010:
| Year | R-Squared |
|---|---|
| 2022 | 0.5254 |
| 2021 | 0.4018 |
| 2020 | 0.4487 |
| 2019 | 0.5281 |
| 2018 | 0.1078 |
| 2017 | 0.3786 |
| 2016 | 0.2386 |
| 2015 | 0.2129 |
| 2014 | 0.2846 |
| 2013 | 0.3013 |
| 2012 | 0.5472 |
| 2011 | 0.3361 |
| 2010 | 0.2724 |
The 2019-2022 seasons account for four of the top-five seasons in ADP correlation to points per game at the running back position.
This past season was the highest since 2019, but we have been operating over the 40% mark in the implied correlation between ADP and points scored per game in each of the past four seasons after just once over the previous eight years.
Now, unfortunately, the running back position itself has seen a drain in opportunity and output over that span, which has played a part in reducing that strike zone.
RB1: Do We Still Have to Pay to Play?
Looking at the chart, you can see where all of the players that scored 20 or more PPR points per game are clustered.
There are 42 seasons on our chart in which a running back has averaged 20 or more points per game.
Just four of those came from players selected at RB30 or later.
There was a fifth from 2018 James Conner (RB55 in ADP) that did not make the arbitrary cutoff on the chart of players selected as an RB4 or higher in traditional 12-team formats.
36 of those 42 seasons came from running backs that were selected within the top-12 of their position that season.
23 of them were top six selections while nine were top three picks at the position.
Last season, we only had two backs who averaged over 20 PPR points per game. Austin Ekeler and Christian McCaffrey were selected as the RB2 and RB3 overall in ADP.
As an extension of those notes, zero of those running backs were on average selected as an RB2 (RB13-24). To keep us honest, Josh Jacobs was the third-highest scorer in points per game (19.3) and was the RB20 in ADP a year ago.
Over the course of the sample since 2010, 55.2% of all RB1 scoring seasons have come from running backs selected as RB1 in fantasy drafts.
This has gone up in recent seasons as well, which is why our correlations have spiked. Since 2019, 60.4% of all top-12 scoring seasons have come from running backs selected as top-12 players at the position.
In 2022, it was 8-of-12 backs.
You can still run into RB1 production in drafts, but we are good at setting the market, and the top scorers are often found at the top of drafts.
Of the 13 running backs that led their position in overall scoring that season in our sample, 10 of them were selected as RB1 options in drafts while seven were top-five selections.
From a per-game perspective, the top running back selected has been successful when on the field.
As a group, the RB1 overall selection has averaged 18.7 points per game with just three of those 13 backs averaging fewer than 15.0 points per game.
But just three of these 13 backs ended up playing a full season, highlighted over the past three seasons with Christian McCaffrey (the RB1 in ADP 2020-2021) and Jonathan Taylor combining to play just 21 games the years they were the RB1.
The last time the RB1 in overall ADP played 16 games in a season was Todd Gurley back in 2016.
That is the gift and the curse of elite running backs in a nutshell.
If you want a front-end scoring running back – and you do because they still provide a ton of positional leverage – you will have to bet on them early in your drafts.
But the injury component of the position does place extreme volatility even on the safest of picks per game.
Running Back Tiers and Rate of Players Matching/Exceeding Draft Position and High-Scoring Rates:
| RB ADP | Match+ | RB2% | RB1% | Top-6% | Top-3% |
|---|---|---|---|---|---|
| RB1 | 54.5% | 75.3% | 54.5% | 28.5% | 19.4% |
| RB2 | 49.4% | 49.4% | 19.9% | 8.3% | 2.6% |
| RB3 | 56.4% | 35.3% | 11.6% | 5.1% | 0.6% |
| RB4 | 59.6% | 21.8% | 8.3% | 1.9% | 0.6% |
Hit and bust rates are fairly nebulous for fantasy since end-of-season rankings say more about the context of the position that season than the individual players outside of a select few at each position.
Outside of having the top few players at each position, the rest of the positions will largely be about being in the right pockets of high production and avoiding the low production for players in the season.
With that grain of salt applied, we are still going to talk about some players meeting season-long expectations based on their labeled draft cost.
Breaking down the backs here into tiers such as RB1 (the top-12 backs selected), RB2 (RBs 13-24), and so on, we can take a look at how often the players in those tiers are matching their sticker price in terms of draft tier, how often players from those tiers have turned in an RB1 scoring level campaign, and which ones have been a top-six scorer from a season-long stance.
Once again, you can spot the safety of the top tier of backs about the rest of the position.
75% of the players selected as an RB1 have at least produced as an RB2 or better while over half of them have finished as an RB1 that season.
Things immediately begin to linearly decline for each subset as we move along.
As we mentioned earlier, zero RB2 options in ADP have averaged 20 or more points per game in this sample since 2010.
Taking that a step further, just 31 of the 156 backs to be selected in that bucket of running backs have posted an RB1 season. Just under a 20% rate.
Last season, only Nick Chubb (RB13 in ADP) and Josh Jacobs (RB20) were RB1 scorers from that bucket.
Think about that from a top-down view.
On average just 2.4 running backs selected as an RB2 produce on an RB1 level per year.
Now put into context where those players are being selected in actual fantasy drafts.
This is why the meta has changed to drafting WR-forward.
Only four backs selected in this area of drafts a year ago even managed to average 15.0 fantasy points per game.
As mentioned to open, we already know that not one of our elite scoring seasons since 2010 has come from a back selected on average as an RB2 (RB13-RB24) in drafts.
Josh Jacobs was a legitimate hit in this area from a year ago, but you are trying to thread a tight needle in landing an elite option here. Just four backs from this subset have produced a top-three scoring campaign over the past 13 years.
This is how the “running back dead zone” has gained a lot of momentum across the general population of gamers in recent seasons.
If you have been a member of this site or followed my work over the years, then you have been locked onto the same information of how this came to be from above.
Anchor-RB, Hero-RB, or whatever moniker you use for targeting an early-round RB from the true RB1 strike zone and then waiting on addressing the RB2/FLEX portion of the position has been my preferred top-down draft strategy for years. This table is the backbone of that game theory.
This table here is also reflected in our rankings for 2023.
We value the RB1 portion of the position and push the RB2 portion of the position down because the number of backs per season that are going to make a true difference or cripple us when facing them is greatly reduced.
The bad news is that the field has finally caught up.
I believe the back end of the RB1 pool is still being discounted, but If you have been drafting leagues on Underdog this offseason, then you can see that this is nearly entirely reflected in ADP.
In the current ADP today on general sites, The RB13 is being selected at pick 31 overall, the RB18 at pick 44 overall, and the RB24 at pick 63.
I do still believe the top-end running backs are a touch undervalued this offseason, but this is not a situation where there is a collective overaction, the data supports that the game has properly calibrated itself in pricing the running back position properly.
Selecting Better Backups and Working the Dead Zone:
While things fall way off hitting the RB2 bucket of backs, things get exponentially worse trying to run into elite seasonal production the further down the rabbit hole we go.
Once we hit the RB4 range, that subset has even produced more RB1 scorers than the RB3 tier, although they lag in the hit rate of RB2 and top-six scoring seasons.
One thing we can do here, however, is flip the dead zone on its head and make it work for us.
Not just by selecting more wide receivers while those backs are going off the board, but also by making better decisions with our later picks at the running back position attached to those backs.
Over the course of our sample, there have been 30 running backs that were drafted behind another running back on the same roster that have finished as RB1 scorers.
Now remember, that number is just one fewer than our total of RB1 hits coming from that RB2 tier of backs in ADP.
Of those 30 backs, 22 of them have come attached to a lead running back that was selected in that RB2 portion of drafts. Just six were attached to RB1 selections.
In other words, if you are selecting a player that is the RB2 on his team, you have exponentially better odds of running into a breakout season if his team RB1 is a dead zone back. Last season, both Rhamondre Stevenson and Tony Pollard were massive hits based on this criteria.
Another 55 backs who were drafted behind another running back on the same roster have finished as RB2 options for the season, giving us 85 total backs (6.5 per season) that were not even the first running back selected on their teams in fantasy drafts that have finished as an RB2 or better in a fantasy season.
Of those 85 backs, 63 of them (74.2%) came attached to team RB1 options being selected as RB13-36 in fantasy drafts while 44 of them (51.2%) have come attached to backs that were selected in the RB2 “dead zone” range of ADP.
When selecting RB2 or later options on a team level, target those running backs attached to running backs currently being drafted in the dead zone.
We have to throw some blind darts on who are the direct backups to Joe Mixon, Alexander Mattison, and James Conner, but some primary targets from that area that you can be drafting now are David Montgomery, Tank Bigsby, Zach Charbonnet, Gus Edwards, Chuba Hubbard, Devin Singletary, and Kyren Williams.
There are strong odds that of the RB2 or later options that hit this season, they come from that group.
While pursuing the backs attached to the front-end backs has not carried a high hit rate, grabbing the backups to backs in those subsequent tiers has.
Handcuffing elite running backs has rarely paid off for fantasy for multiple reasons, but the primary one is that the next backs in line rarely take over a full-time role that those backs carry in the first place because they are just not as talented.
Joshua Kelley is not becoming arbitrage on Austin Ekeler. Matt Breida is not going to take over Saquon Barkley’s workload.
The most interesting handcuff to a front-end RB1 option is Tyler Allgeier (since we already have evidence that he is productive in a lead role).
You can make a similar case for Elijah Mitchell, but he has to stay on the field himself.
I can see some “squint to see it” from Tyjae Spears should anything happen to Derrick Henry, but Henry is arguably the most unique workload back we have. No other backs have sustained a workload like has, so anticipating a rookie running back to match that is lofty.
Takeaways:
- We have collectively been at our best in setting the running back market over the past four seasons compared to a decade ago.
- If you want an elite seasonal running back, the odds still say that you have to pay for one.
- RB1 backs have carried the highest floors and ceilings, but things immediately become sketchy afterward.
- The RB2 subset of backs is the riskiest investment in drafts paired with draft cost.
- Target selecting backup running backs attached to backs in the RB2 tier of ADP.
[/wlm_private]