You’ve heard it time and again: third down is the money down. Try searching for “first down is the money down” and there’s not a lot there. Avoiding punts is obviously great for an offense, and (if you trust what you hear during a broadcast) converting third downs can have a demoralizing effect on the defense. But in the scheme of things, there aren’t that many third downs, so how much impact can they really have on the outcome of a game?
Let’s take a look at the extent to which success on third down is both valuable and consistent.
How Important are Third Down Conversions?
Comparing the Value of Each Down
From this point forward, we’ll be excluding plays with a win probability below 5% and above 95% to get rid of situations where third down success might not even be a priority for the team.
To start, it might be useful to show how important third downs are overall compared to other downs. We can measure the importance of each down by examining how much Expected Point value is at stake on each play, both on a per-play basis and as a total. To do this, we take the absolute value of the EPA on each play, and then average and sum it.
Absolute Value of EPA by Down, 2015-2018 (Excluding Blowouts)
| Down | Plays | Avg of |EPA| | Sum of |EPA| |
|---|---|---|---|
| 1 | 48,541 | 0.61 | 29,595 |
| 2 | 35,782 | 0.83 | 29,794 |
| 3 | 22,095 | 1.32 | 29,084 |
| 4 | 1,234 | 2.59 | 3,194 |
Unsurprisingly, the typical value being gained or lost on a play increases dramatically over the course of a series of downs. But, of course, the number of fourth downs is miniscule compared to the other downs, so to get a better sense for the overall importance we can use the sum. When you add up the total value thrown around over the last three seasons, the first three downs are roughly comparable to each other, and fourth downs are much less relevant.
As important as anything in this table is that, while third down plays are less than half as common as first down plays, the total value of those plays is almost equal. This tells us that third downs are, by this metric at least, just as valuable as first and second down. But not more important, especially considering their infrequency.
The Demoralizing Effect of Third Downs
Broadcasters love mentioning that getting off the field on third down — or failing to do so, especially on third-and-long — is huge for a defense. This makes sense intuitively. Being close to a successful series and getting a respite then having that slip through your fingers can’t be fun. But is there evidence of such an effect?
We took all first down plays that were not the first play of a drive and split them according to the down that immediately preceded those plays. If there’s a demoralizing effect on the defense from a third down conversion, we might be able to see that in the performance of the offense afterward. Here’s a plot of the average EPA on those following first downs (excluding plays that start in the shadow of either goalpost to avoid small samples).
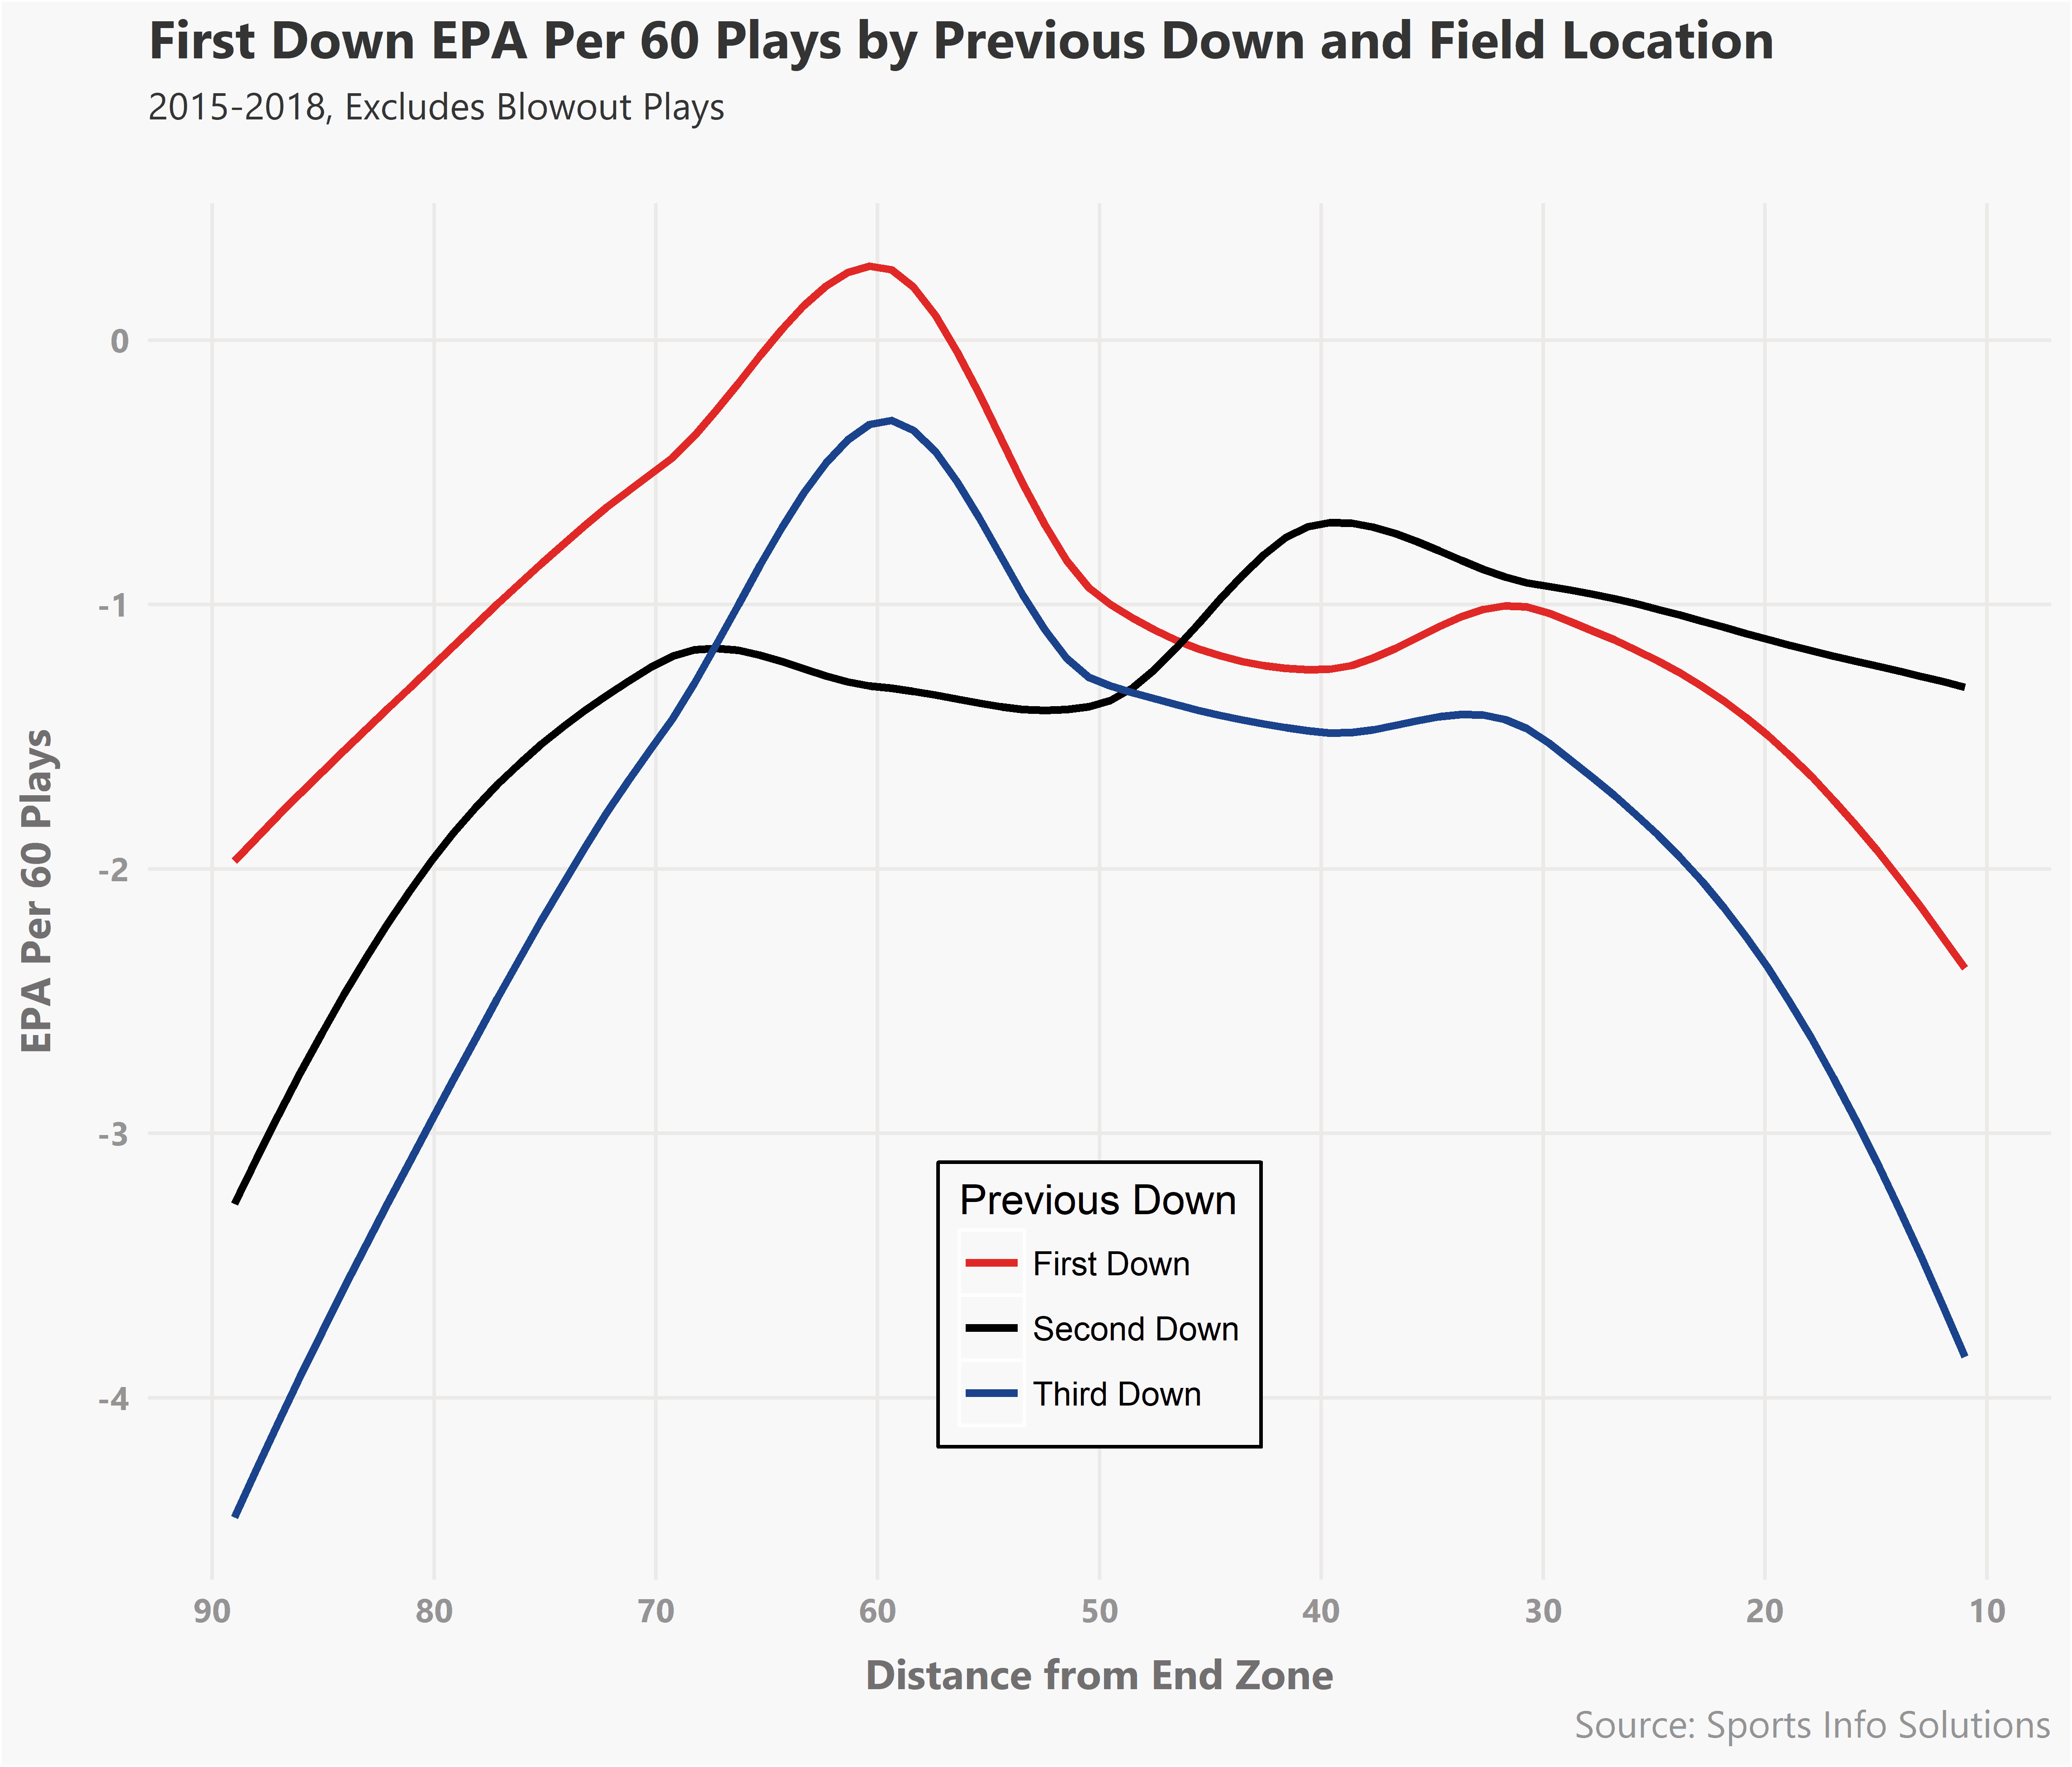
For the most part performance on first downs after a third down looks worse than it is after a first down. To some extent this is because better teams are more likely to have gotten a big play on first down, leading them to be over-represented in the first down sample here. These differences are not statistically significant, however. And for what it’s worth, the same is true if we instead look at first downs following a 3rd-and-long.
Third Down Success and Winning
If third down plays are just as valuable in aggregate as first and second down plays from an EPA perspective, are they also just as valuable to winning?
First we should acknowledge that we should expect a certain amount of consistency between early downs and third down. A good offense is generally a good offense regardless of the situation. We can verify this in a few different ways; here we use the plot below, which shows the relationship between a team’s rate of getting to third down and its Positive Play Percentage (Positive%, the percent of plays with a positive EPA) on third down. That stat is essentially the same as third down conversion rate but can apply just as easily to other plays (which we will do momentarily). All results exclude plays in blowout situations (i.e. avoiding win probabilities below 5% or above 95%).
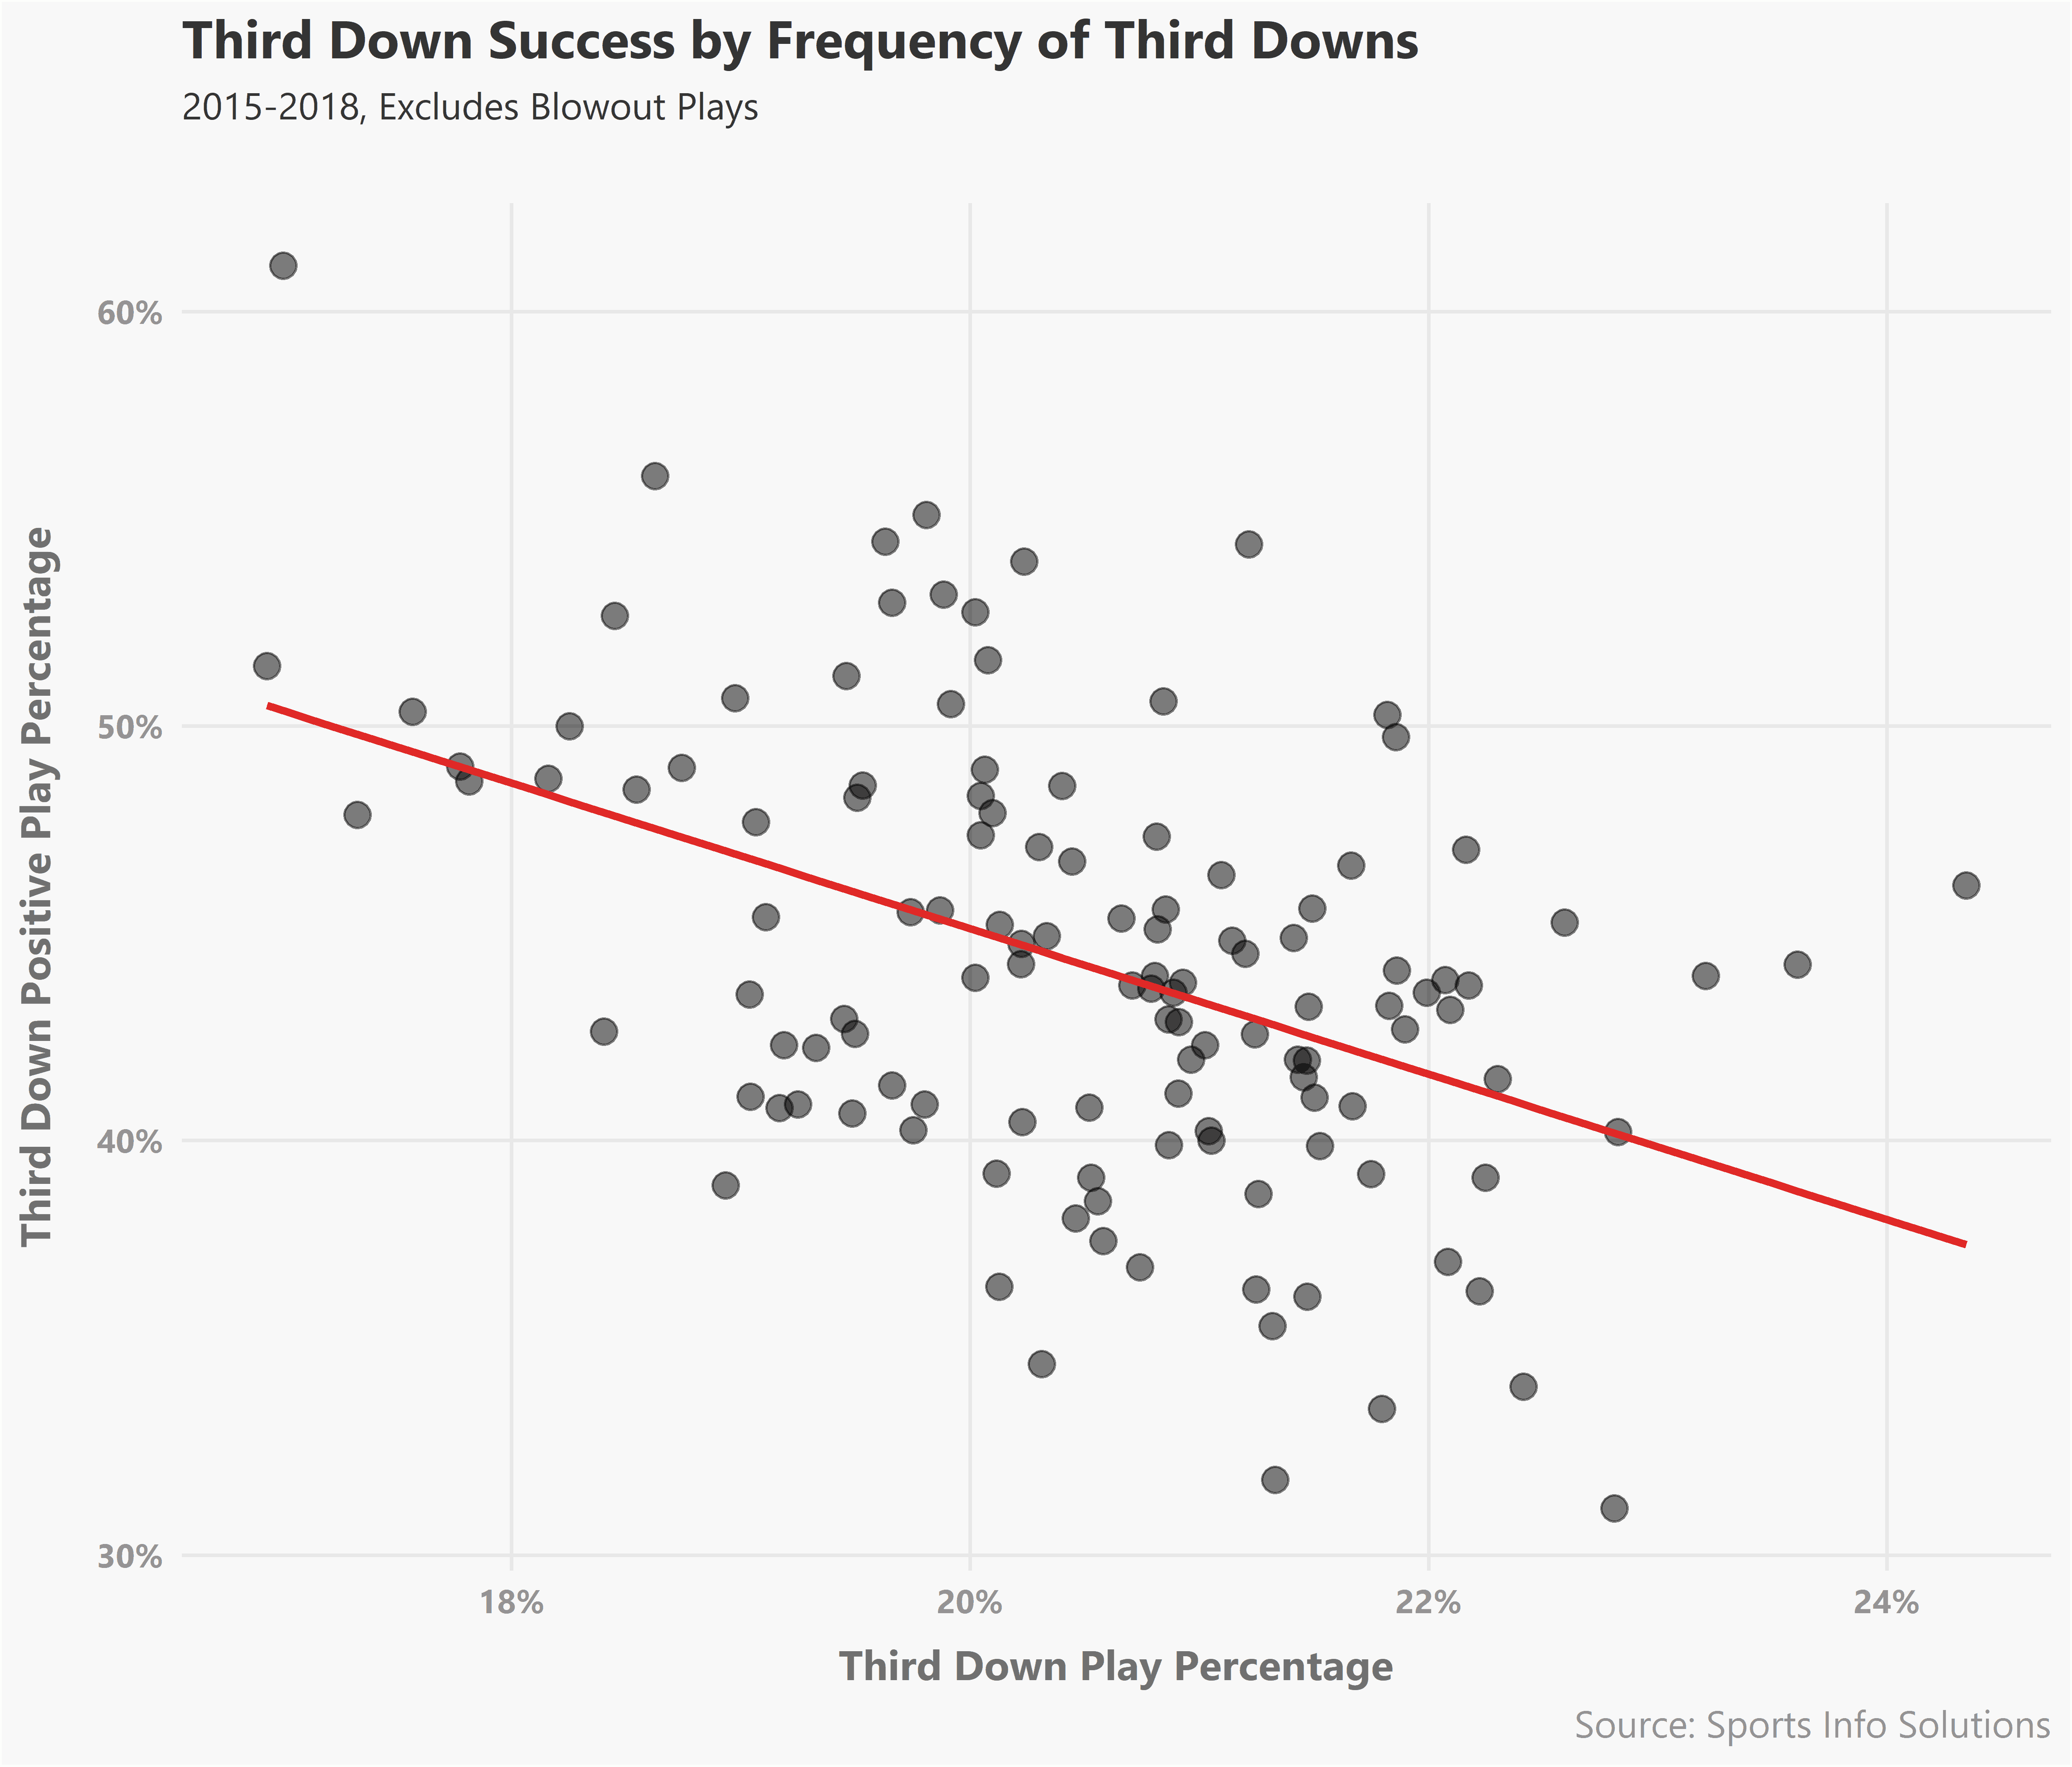
It makes sense that the teams who do better on third down are seeing fewer of them, because they are also better on first and second down. Of course, the sample of third down plays is relatively small, so there’s plenty of variability in third down performance even among the good offenses and bad offenses. But in general, we see this phenomenon occurring.
From a game-to-game perspective, though, there does appear to be something to third down performance beyond that.
Consider a logistic regression trying to predict whether a team would win using non-blowout plays of the last three regular seasons. Using Positive Play Percentage as a single metric usable in both situations, a team’s in-game third down Positive% does a slightly better job than early down Positive% at predicting whether a team will win. Here the model quality is measured by the Akaike Information Criterion (AIC), which measures goodness-of-fit given the complexity of the model. Lower numbers indicate less error, and therefore a better model.
| Model | AIC | Early Downs Z Score | Third Down Z Score | Early Downs p-value | Third Down p-value |
|---|---|---|---|---|---|
| Early Downs | 2685 | 11.8 | -- | 3 x 10^-32 | -- |
| Third Down | 2565 | -- | 14.9 | -- | 4 x 10^-50 |
| Both | 2466 | 9.6 | 13.5 | 5 x 10^-22 | 10 x 10^-42 |
Throw both the team’s early down Positive% and its third down Positive% into a model and not only does the model improve (unsurprisingly), but both are quite significant predictors, with the third down rate actually being the more impactful of the two. So while the number of plays is much lower, the total exchange of EPA is consistent with first and second down individually, and we should expect third down performance to track with early down performance. Third down success is still at least as predictive of winning as both early downs.
Is Third Down Performance Consistent?
Let’s get this over with — success on third down isn’t something teams are able to sustain consistently. A team might see over 200 third downs in a season on the high end, so there’s a decent sample on that scale, but as anyone who does fantasy football projections knows, projecting per-play efficiency is a tough nut to crack.
As it turns out, neither early down performance nor third down performance is that consistent from year to year.
The chart below shows the year-over-year change in Positive% rank on early downs and on third downs over the same time frame, focusing on the top ten and bottom ten teams each year.
We can see that in either case we find a bunch of teams lurched from top-ten to below-average or from bottom-ten to above average (including some teams who dropped over 25 spots on third down). Among those movers, there were a couple more third down movers overall and more teams who moved 15 spots or more.
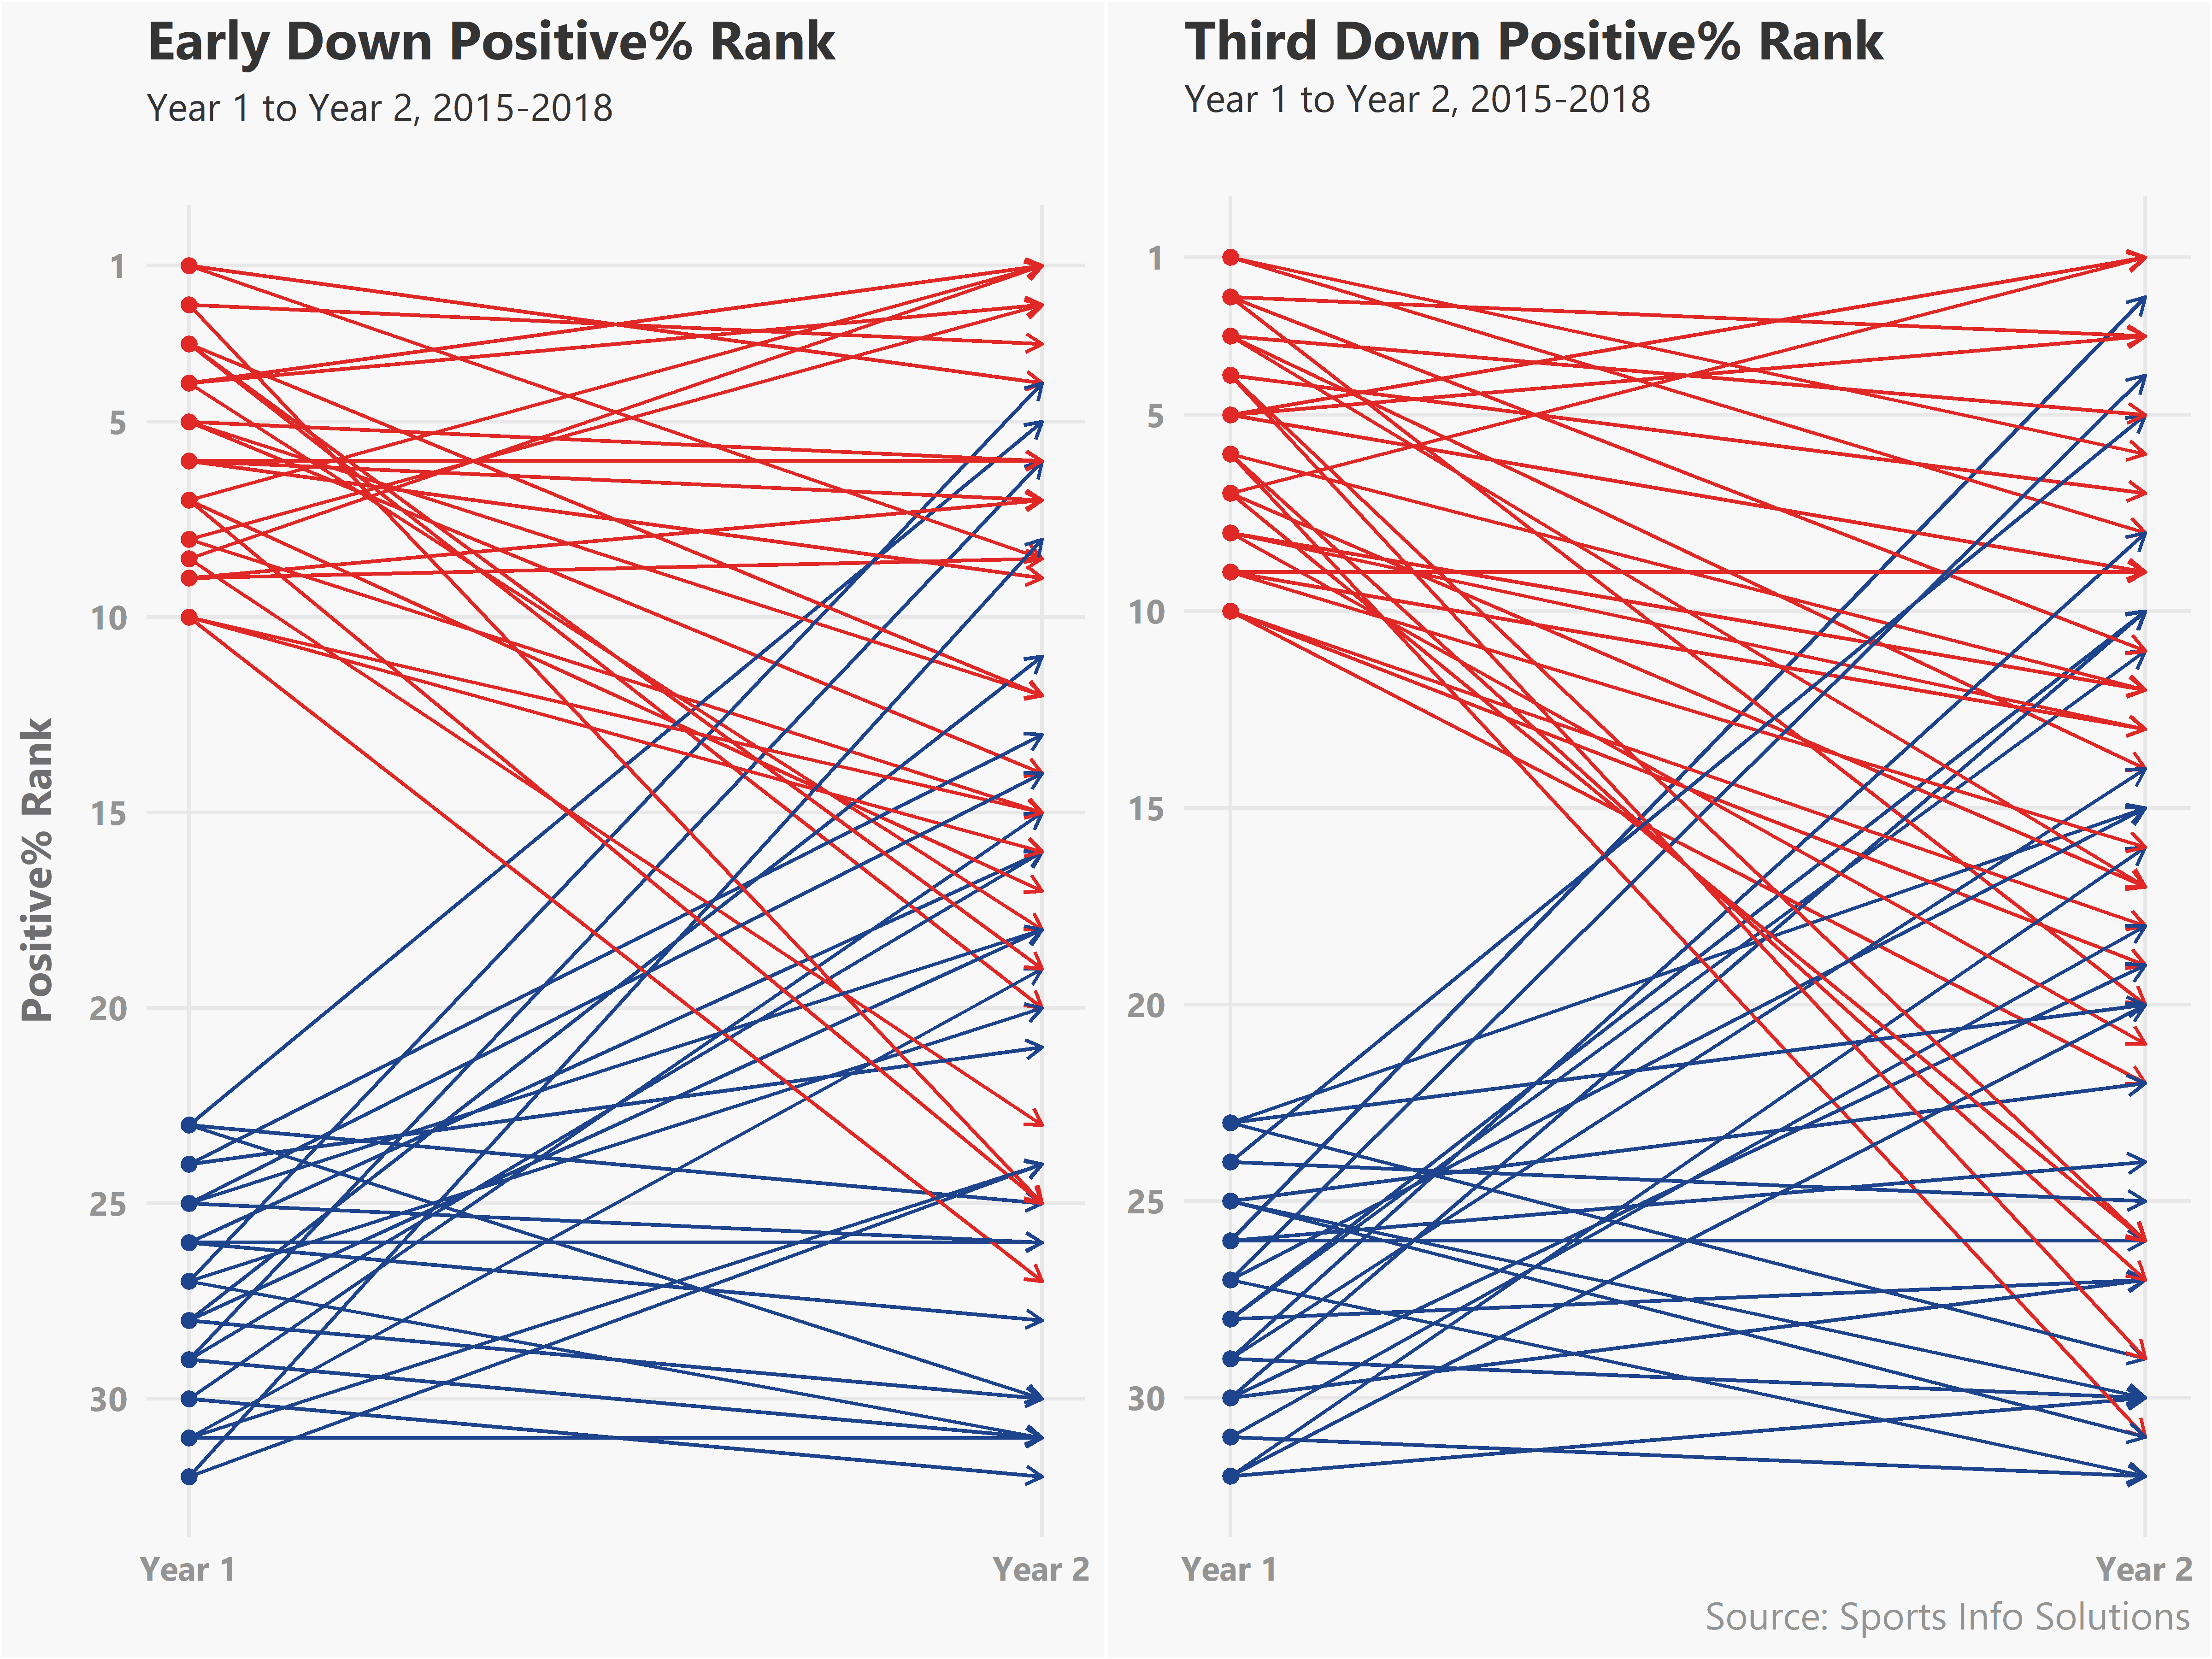
There’s some evidence of third down being less consistent, but it’s clear that if it is, it’s not by a lot. Correlational analysis shows a similar finding. Taking a team’s rank in Year 1 to predict Year 2, we find that the early down r-squared is 0.14, compared to 0.10 on third down. Neither of them account for even 15% of the variability in the next year’s value, but the early down value is a little higher. Comparing half-season to half-season gives similar results, with even smaller r-squared values owing to the smaller sample sizes.
What Did We Learn?
Announcers have it right to a large extent. Third down plays appear to be at least as valuable as early down plays in terms of scoring points and winning games, even accounting for their relative scarcity. The best offenses afford themselves a double-whammy of success by both avoiding third downs and performing well when they do face them. That said, success on third down isn’t something that even the best offenses can count on, especially on a year-to-year basis.